lab10 : Data analysis and plotting
| num | ready? | description | assigned | due |
|---|---|---|---|---|
| lab10 | true | Data analysis and plotting | Wed 08/17 01:15PM | Mon 08/22 04:45PM |
Data analysis and plotting
In this lab you will work with some data about some cars. You will learn how to plot the data, make a histogram, find correllations between two sets of values.
References
As you work through the steps below, you may find it helpful to refer to:
- the notes from the lecture Miles gave on Wednesday 08/17, which can be found here: Transcript of Python Shell Session
Step 1: Create a lab10 repo
Go to github.com and create a new repo called spis16-lab10-Name-Name using Method 1. When creating the repo import the starter code from this git repo:
Then use git clone to clone this into your ~/github directory.
Step 2: Work with the file car_analysis.py file
In the starter code, you’ll find the file car_analysis.py. Open this file in IDLE, and run it.
This file loads a variable into memory called cardata. That cardata variable is list of dictionaries.
Now, you might think that the first thing you’d want to do is type cardata at the Python prompt, and hit enter, but PLEASE DON’T DO THAT. It isn’t that anything awful will
happen; it is just that it will temporarily lock up your computer session, and you might have to close it and start over.
Let’s explain two things right away:
- What you should do instead
- Why typing
cardataand hitting enter (which you should NOT do) is a bad idea.
What you should do instead
Here are several things you can do after running the car_analysis.py file with the cardata variable that are
perfectly fine:
- Type
cardata = cars.get_cars()to set up the variablecardata.- You might want to just add that line of code immediately after the
if __name__==main: line, before theprintstatement, so that it always sets up thecardata` variable when you run the file.
- You might want to just add that line of code immediately after the
- Type
type(cardata). - Type
len(cardata) - Type
cardata[0] - Type
cardata[42] - Type
type(cardata[0]) - Type
cardata[-1]
Try each of those, and see what you get. Your purpose right now is simply to understand what the data represents by looking through it.
For the result of type(cardata[0]) you should have gotten dict, which stands for dictionary.
If you need a review about Python dictionaries, you can consult the lecture notes from either Phill or Miles, or you can review this page: Python: Dictionaries
When you type cardata[0], it may look a little messy to you. A way to see the data in a more attractive way is to use
the library pprint which stands for pretty print.
write this code in idle:
>>> cardata[0]
>>> import pprint
>>> pprint.pprint(cardata[0])

>>> cardata[0]
{'Engine Information': {'Transmission': '6 Speed Automatic Select Shift', 'Engine Type':
'Audi 3.2L 6 cylinder 250hp 236ft-lbs', 'Engine Statistics': {'Horsepower': 250, 'Torque':
236}, 'Hybrid': False, 'Number of Forward Gears': 6, 'Driveline': 'All-wheel drive'},
'Identification': {'Make': 'Audi', 'Model Year': '2009 Audi A3', 'ID': '2009 Audi A3 3.2',
'Classification': 'Automatic transmission', 'Year': 2009}, 'Dimensions': {'Width': 202,
'Length': 143, 'Height': 140}, 'Fuel Information': {'Highway mpg': 25, 'City mph': 18,
'Fuel Type': 'Gasoline'}}

>>> import pprint
>>> pprint.pprint(cardata[0])


{'Dimensions': {'Height': 140, 'Length': 143, 'Width': 202},
 'Engine Information': {'Driveline': 'All-wheel drive',
                        'Engine Statistics': {'Horsepower': 250,
                                              'Torque': 236},
                        'Engine Type': 'Audi 3.2L 6 cylinder 250hp 236ft-lbs',
                        'Hybrid': False,
                        'Number of Forward Gears': 6,
                        'Transmission': '6 Speed Automatic Select Shift'},
 'Fuel Information': {'City mph': 18,
                      'Fuel Type': 'Gasoline',
                      'Highway mpg': 25},
 'Identification': {'Classification': 'Automatic transmission',
                    'ID': '2009 Audi A3 3.2',
                    'Make': 'Audi',
                    'Model Year': '2009 Audi A3',
                    'Year': 2009}}
If you like the way that looks then you may use it to look at data for the rest of this lab and really for any time you use a dictionary!!!!
Why typing cardata and hitting return is a bad idea
The reason is simple: cardata is a huge list. It takes a very long time to convert that list into its string representation and then print it out in your IDLE Python Shell. While it is doing that string conversion, your entire session just locks up, and it appears that nothing is happening. Eventually, you will get your prompt back, along with a zillion pages of output. But that probably isn’t what you wanted to see.
Some other things you could do
Each element in the list cardata represents a dictionary of attributes about a specific type of car.
If we want to see all the pieces of data that we can access for a car, we can just look at the string representation of a single Python dictionary for a single car, like this:
>>> cardata[0]
{'Engine Information': {'Transmission': '6 Speed Automatic Select Shift', 'Engine Type': 'Audi 3.2L 6 cylinder 250hp 236ft-lbs', 'Engine Statistics': {'Horsepower': 250, 'Torque': 236}, 'Hybrid': False, 'Number of Forward Gears': 6, 'Driveline': 'All-wheel drive'}, 'Identification': {'Make': 'Audi', 'Model Year': '2009 Audi A3', 'ID': '2009 Audi A3 3.2', 'Classification': 'Automatic transmission', 'Year': 2009}, 'Dimensions': {'Width': 202, 'Length': 143, 'Height': 140}, 'Fuel Information': {'Highway mpg': 25, 'City mph': 18, 'Fuel Type': 'Gasoline'}}
>>>
Or, if I want to see just the keys in the dictionary, I can use cardata[0].keys()
>>> cardata[0].keys()
['Engine Information', 'Identification', 'Dimensions', 'Fuel Information']
>>>
Note here that each entry of cardata is actually a dictionary of dictionaries.
- Type
type(cardata[0]). - Type
type(cardata[0]['Engine Information']). - Type
cardata[0]['Engine Information'].keys()'). - Type
type(cardata[0]['Engine Inoformation']['Engine Statistics']['Horsepower']).
For the last one, you should get type int. If we are interested in Horsepower, we must look through each dictionary until we find it.
assign a variable to cardata[0] like this:
>>> car0 = cardata[0]
Exercise 1
Given the code from above, that is:
>>> car0 = cardata[0]
what would you write to output the year of this particular car?
Once you determine the answer, you can use that answer to fill in the code for the function def yearOfCar(car) in the
file car_analysis.py that is part of the starter code in your repo.
Please fill in that function before continuing. Then test it with:
>>> car0 = cardata[0]
>>> yearOfCar(car0)
(the year of the car should appear here)
What to do with a list of integers
In order to be able to answer these types of questions, we need to be able to work with the data in various ways. One of our most basis tools is to reduce the data down to a simpler form: for example, instead of a list of dictionaries, just a list of numbers.
Your task is to write functions that will take as their parameter, cardata and return various things. Then we will plot
certain things about these cars. The remainder of the lab walks you through doing just that.
Exercise 2: horsepower function
Write a function def horsepower(cardata): in your file called car_analysis.py that returns a list of integers of horsepowers for each car in the list cardata.
Set hp_list = horsepower(cardata). It should be a list of integers. Try the following commands:
type(hp_list)
min(hp_list)
max(hp_list)
Do those seem like reasonable values? If not, maybe you should try your list again.
Plotting Data
The next thing we will do is plot the data hp_list. We are going to use the library matplotlib. It can do a variety
of visualizations, you may remember in Miles’s class last week some of the uses of matplotlib. For example,
you can plot a scatter plot, a line plot and a bar chart among other things. In this lab, we will be plotting all of those things.
Type this into your car_analysis.py file:
import matplotlib.pyplot as plt
This is a way of giving a nickname to a library so that whenever you call matplotlib.pyplot, you only have to write plt. This is a standard convention for this specific library. If you are interested in more applications of matplotlib.pyplot, most of the literature will use this convention.
Let’s plot hp_list as a scatter plot.
The scatter plot plt.scatter(xs,ys) takes two lists of numbers (integers or floats) where each list is of equal length and it plots a point at each coordinate xs[i],ys[i].
hp_list is only one list so we are going to have to make up another list so that we can plot it.
The other list we will use is the list range(len(hp_list)). This is a list of integers [0,1,...,len(hp_list)-1].
We put in the len function to be sure that it will have the same length as hp_list.
So, in your python shell write
plt.scatter(range(len(hp_list)),hp_list)
It should output something like
<matplotlib.collections.PathCollection object at 0x00000000096B4EB8>
This is just saying that it has built your plot but it hasn’t actually shown you yet because you may add things to the plot if you like. for example, you could write
plt.title('Horsepower of cars in cardata')
and it will add a title to the plot. Let’s view the plot that we made
plt.show()
This will generate a scatter plot with your title. Notice that in your idle, the »> hasn’t reappeared. To get back to that, you must close the picture. If you would like to save that picture for later, then you could click the little disk image on the bottom of the picture.
There is another way to save the image. That is to write
plt.savefig('filename')
and it will save the plot as the ‘filename’ in the same repo that you started in.
Both plt.show() and plt.savefig(‘filename’) “reset” the plot and it will start fresh the next time you define a plot.
What happens if you write plt.show() again? Nothing! It is because now the plot has been erased. You must build another plot every time.
- Go ahead and make the plot again on your own, and instead of writing plt.show(), write plt.savefig(‘scatter_HP’) and it will save it as that name.
Histograms
This scatter plot that we made is kind of a mess. There is a much better way to visualize a list of numbers as an image. It is called a Histogram. Basically, a histogram is a bar chart of ranges where the height of the bar is based on how many data points fall into that range.
add this function into your car_analysis.py file
from collections import defaultdict

def histogramify(data,bins):
	M = max(data)
	m = min(data)
	interval = (M-m)/bins
	hist = defaultdict(int)
	for d in data:
		for i in range(bins):

			#This line originally said: if d>m+i*interval:
			if d>m+i*interval and d<=m+(i+1)*interval:
				f=m+i*interval
		hist[f]+=1
	return hist
This is a function that takes as an input a list of data data and the number of bins bins. The number of bins will
evenly divide the set of values into that many ranges. For example, if the maximum of your list is 200 and the minimum is
100 and bins is ten, then histogramify will split your data range into 10 equal “bins” i.e. 100-110,111-120,121-130,…etc.
Then it will output a defaultdict where the keys and values are both integers. The keys are the lower bound of each “bin”
and the values are how many data points fall in that “bin”.
We are going to use histogramify to plot a histogram of the horsepower data. Assign
hist_HP = histogramify(hp_list,25)
We are going to plot a bar chart, plt.bar(xs,ys) takes two lists of data, each the same length where the height of the bar at xs[i] is ys[i].
I am going to show you how to make the lists.
xs = range(min(hp_list),max(hp_list))
The x axis represents the actual horsepower values so we want xs to range through each value.
The y axis represents the number of cars with horsepower in a specific range. hist_HP holds all of that data
in a defaultdict format so if you input a key that hasn’t been assigned, it will give you a value of 0.
However all other keys that have been assigned will give you the amount of cars that have horsepower in that range.
ys = [hist_HP[x] for x in xs]

plt.bar(xs,ys)
plt.show()
If you have done it right, you should get something that looks like
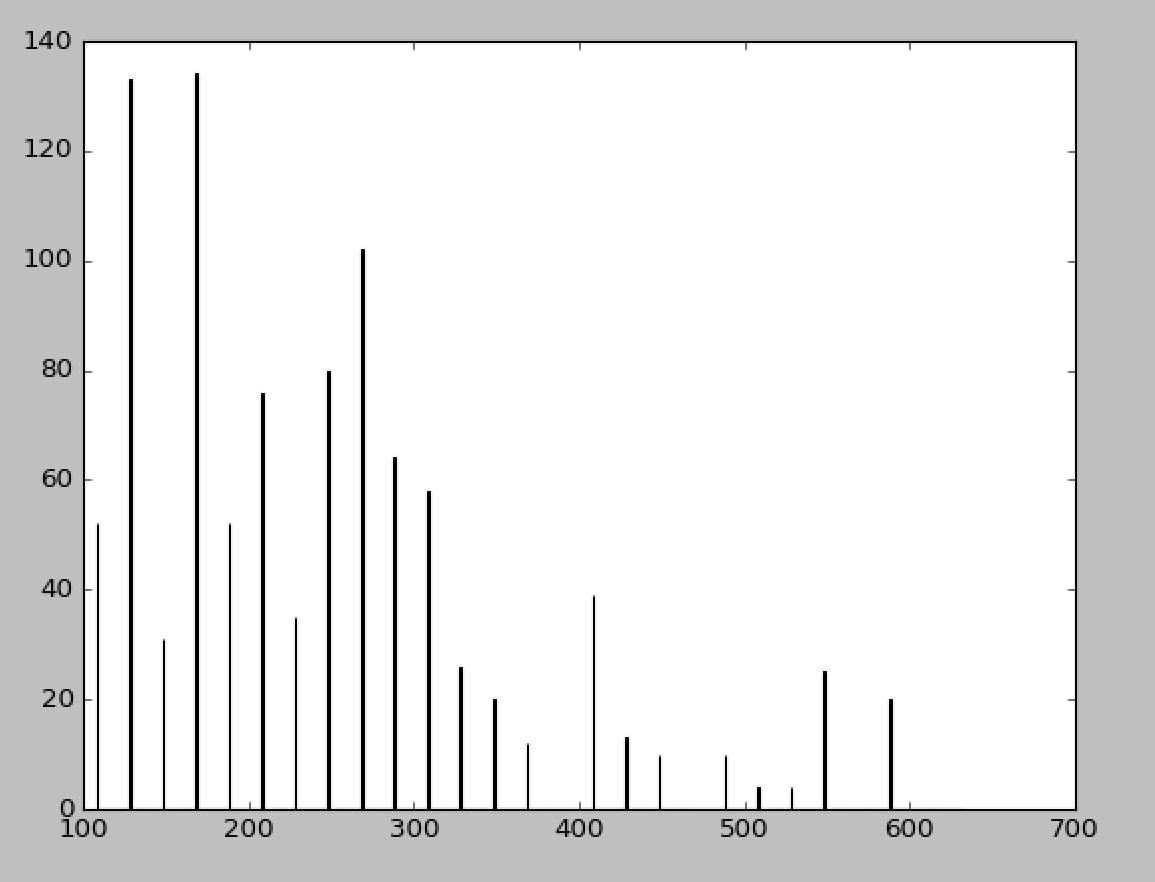
Notice that the bars are really thin. The default width is set to 1. So let’s change the width. The way to do that is to add another argument to plt.bar
So now call
plt.bar(xs,ys,20)
plt.show()
It should have made the bars wider.
Now, let’s make a histogram with a title and labels for the x-axis and y-axis
plt.bar(xs,ys,20)
plt.title('Histogram of Horsepower Data')
plt.ylabel('Number of cars')
plt.xlabel('Horsepower')
plt.savefig('Histogram_HP')
This picture will be saved in your repo.
- Exercise 4: Write a function
def MPG(cardata):in your file calledcar_analysis.pythat returns a list of integers of ‘Highway MPG’ for each car in the listcardata. AssignMPG_list = MPG(cardata). Make a histogram ofMPG_listwith 25 bins just as we did forhp_listand save the figure asHistogram_MPG. (Remember to histogramify your data and label your axes and title.)
More than one set of data.
Right now, we have two lists of data i.e. hp_list and MPG_list. It could be that there is a relation between these two values.
What do you think the relationship is?
It’s hard to say without looking at the data. It’s hard to read if you look at the actual numbers so instead let’s plot the data as a scatter plot. Run this code:
plt.scatter(hp_list,MPG_list)
plt.title('Horsepower vs MPG')
plt.ylabel('Highway MPG')
plt.xlabel('Horsepower')
plt.savefig('scatter_HP_MPG')
What do you see? It looks as though the more horsepower you have, the less MPG your car gets. Does this make sense? As scientists, it is important to think about your results and see if they make sense. This is where some hypotheses come from.
It would be nice to have some numbers to describe this relation and not just qualitative descriptions.
We are going to use the library called numpy. It has many uses, especially for statistics and mathematics.
We are only going to use one function called numpy.linalg.lstsq(X,y)
What it does is give you the equation of a line that “best fits” the data. What does that mean? Well, it means that it is the line that has the least sum of squares of errors. This is important but we will not discuss this here. This space is to practice using the computer where least squares error is mathematics. (Don’t worry, we’ll discuss it in lecture ;)
What this function does is output 4 values. The first value is all that we need. It will be a pair of numbers. These numbers are the b and m values in the equation of a line y = mx+b.
What are the inputs X and y? X is a list of pairs that look like this [1,HP] and y is a list of MPG. In fact, y is just the
list MPG_list.
Let’s define X as
import numpy
X = [[1,h] for h in hp_list]
y = MPG_list
numpy.linalg.lstsq(X,y)
After calling the last line, you should have an output like this
(array([ 3.68625612e+01, -3.62427603e-02]), array([ 13404.2422533]), 2, array([ 8784.95244788, 12.94173734]))
The first “array” contains two values, these are the b and m of y=mx+b. I want to assign a value to just the first element of this and let’s call it theta.
theta = numpy.linalg.lstsq(X,y)[0]
Then we will plot the line
xs = range(min(hp_list),max(hp_list))
ys = [theta[1]*x + theta[0] for x in xs]
plt.plot(xs,ys)
plt.show()
It should just give you a line. This line does not mean much on its own. Let’s plot it with the scatter plot
plt.plot(xs,ys)
plt.scatter(hp_list,MPG_list)
plt.title('horsepower versus mpg')
plt.ylabel('Highway MPG')
plt.xlabel('Horsepower')
plt.show()
Save this figure as HP_MPG_line
What we have done is made a very simple predictor. What we can do with it is predict your car’s MPG, given its horsepower. It is not a perfect predictor but maybe it is pretty good. Make a function to predict this.
def cars_MPG_given_HP(horsepower):
	return theta[1]*horsepower+theta[0]
If you know the horsepower of your car or of a family car, plug it into the function and see what MPG your car should get!!!
- Exercise 5: plot the scatterplot of the horsepower vs the torque. Run the numpy.linalg.lstsq to get theta[0] and theta[1] so that you can plot the “best fit” line on the same plot as the scatter plot. Name your title and axes and save the figure as
Torque_HP_plotin your repo.
After each exercise, commit your changes to github:
git add my_analysis.pygit commit -m "AB/CD describe which function you worked on here"git push origin master
Make sure you have saved all the figures specified and completed all the functions in your car_analysis.py file.